Quick tips on Elasticsearch’s ingesting and searching
Sharing some practices and solutions I went through when trying out Elasticsearch

Elastic Stack, formerly known as Elasticsearch, Logstash and Kibana (ELK Stack), is an open-source project that nowadays offers not only a full-text search and analytics engine but also use cases that ranges from pretty much everything from fresh data time series such as logs and metrics to even yearly backups (Hot-Warm Nodes) due to its highly scalable architecture making it easy to add more resources based on any demand be it more compute nodes for data ingestion, more storage or even more search engine nodes to suffice a search spike period.
Over time Elastic Stack’s went from an Extract, Load and Transform (ETL — Logstash) and analytics solution to a complete enterprise product focused on infrastructure (Beats) and application monitoring (APM), visualization (Kibana), also Role Based Access Control (RBAC), Attribute Based Access Control (ABAC) to address compliance and security issues besides the completely managed interface that works on both on-premisse and cloud environments.
On this article I’m going to focus on some good practices on ingesting and retrieving data from Elasticsearch.
Note: It’s not the objective of this article to list the best practices around infrastructure and configurations. Elastic company has made some good content on those.
The dataset I’m using as a performance measure is of a weather type found here. It has string, timestamp andfloat values for the columns described below:

So here we start listing some rather good practices on data ingestion.
Before continuing I will describe my mappings as well as my environment.
I’m using the m4.4xlarge AWS instance which comprises of 16 vCPUs and 64GB of RAM in which I’m deploying Elastic Stack on top of a Docker Swarm under Amazon Linux. So my infrastructure is as follows:

I’m allocating 8GB of RAM to each Elasticsearch container (counting for the search hammering phase).

Also my mapping settings:
{
    "settings" : {
        "index" : {
            "number_of_shards" : 8,
            "number_of_replicas" : 0
        }
    }
}
1. Prefer bulk data insertion over single API index
Since the dataset comprises of multiple json entries, one approach would be to insert each line one by one as refered by the docs. One example using python:
f = open("file.json")
for x in f:
requests.post("elasticsearch/index/_doc/<docid>",
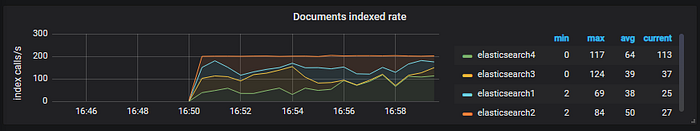
data=json.loads(x))This code would give me an ingestion index rate of about 40 ~ 50 documents per minute on average to elasticsearch cluster as shown on the image below.
Now if I were to implement the bulk API the results are much better.
f = open("file.json")
batch_size = 500
for x in line:
if store_size == batch_size:
send_bulk(store)
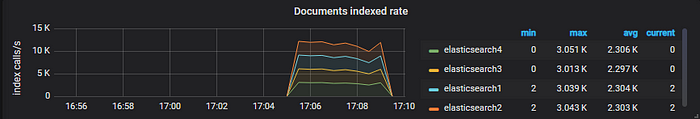
# store entriesThe code above gave me an index rate of about 3k documents/minute which is orders of magnitude better than the previous attempt.
Should I use Logstash?
As we’ve seen so far there’s a number of ways to ingest data to our Elasticsearch cluster. Luckly Elastic has already made an article addressing this question. Here’s some benefits on using Logstash:
- It has a number of different input, filter and output plugins that supports a range of different protocols and architectures.
- Prevents hammering on Elasticsearch cluster and automatically buffers the data by using its persistent queues when it notices the cluster is under heavy load.
Ok. So both points are convincing enough for us to try it out. My logstash.conf:
input {
    file {
        path => "/root/WEATHER_2019-04-24-09"
        type => "json"
        start_position => "beginning"
        codec => multiline {
            pattern => '^{'
            negate => true
            what => previous
        }
    }
}output {
    elasticsearch {
        hosts => ["elasticsearch"]
  index => "test-1"
        template => "file.json"
        template_name => "test"
        template_overwrite => "false"
    }
    stdout {
        codec => json_lines
    }
}
By using Logstash the rate index went high up to around 7k documents which is amazing.

2. Now when searching: Use the scroll API.
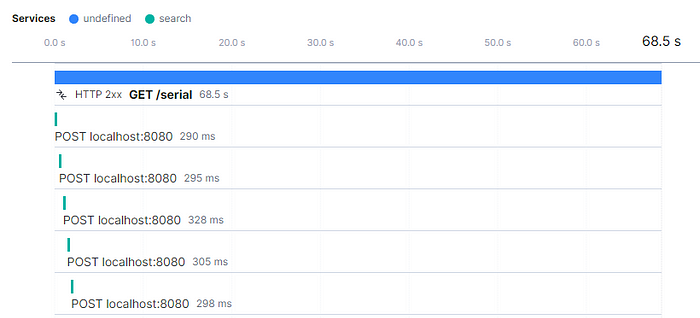
IMHO I think that this is the only option when trying to retrieve results more than 10.000 entries. So slice scrolling search works like pagination where each page can only display a maximum of 10.000 items. You can actually edit that restriction (`index.max_result_window`) but you’ll always end up risking bringing down your entire cluster due to an enough sized window request.
Retrieving over 1.000.000 items using 10k sized windows took about 68 seconds to complete. Elasticsearch’s APM shows each sliced scroll request to the API being made as depicted on the image below.
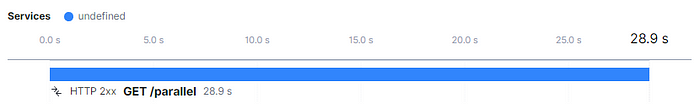
One could try to optimize the request by parallelizing it but It got as much as 2x faster time using any number more than 4 threads.
Beware not to increase the number of threads so that you won’t hammer your cluster too much otherwise you’ll end up facing a screen like this.

Conclusion
The commitment of the Elastic team on Elastic Stack is amazing. The releases are frequent with every new feature aimed to fill a gap such as cluster replications, function beat, new kibana designs, easier resharding, Machine Learning and Anomaly Detection and much more on Elastic Stack’s latest version 7.0.0.
References
Container image taken from: https://www.melbournebioinformatics.org.au/tutorials/tutorials/docker/media/#1
https://www.elastic.co/guide/en/elasticsearch/reference/current/getting-started.html