Comparing Logging Solutions
Loki vs ELK vs SPLUNK. A Case Study.
Logs has long been one of our greatest companion when it comes to investigating a production incident. Gone are the days where one had to parse and delve into a haystack of logs in order to find a cause of an issue. Nowadays, there are plenty of open-source and commercial solutions offering a complete suite of parsing support, correlation and even amazing visualizations.

In this article, I’ll be analysing three well known logging solutions: Grafana Loki, ELK Stack and SPLUNK Core. For each I’ll measure three aspects: usability, ingest performance and query/visualization performance.
Disclaimer: All steps shown below were based solely on my own searching, debugging, tunning and understanding of each technology. Feel free to contribute to it by dropping a comment :)
That being say, let’s start!
Methodology
Hardware
I used a m5.xlarge EC2 instance for each test. It comprises of 4 vCPUs and 16.0 GiB RAM. Each with 300GB EBS (gp2–900IOPS).
Dataset
One month of millisecond granularity randomly created nginx like format log of the sort:
log_format main '{ "time": "[]", "status": "$status", "path": "$request" }'Log sample:
{ "time":"[01/May/2021:00:00:00.000 -0300]", "path":"page153", "status":"302" }
{ "time":"[01/May/2021:00:00:00.001 -0300]", "path":"page112", "status":"304" }
{ "time":"[01/May/2021:00:00:00.003 -0300]", "path":"page6", "status":"408" }
{ "time":"[01/May/2021:00:00:00.005 -0300]", "path":"page54", "status":"404" }
{ "time":"[01/May/2021:00:00:00.007 -0300]", "path":"page113", "status":"304" }
{ "time":"[01/May/2021:00:00:00.009 -0300]", "path":"page81", "status":"200" }
{ "time":"[01/May/2021:00:00:00.011 -0300]", "path":"page75", "status":"302" }
{ "time":"[01/May/2021:00:00:00.013 -0300]", "path":"page147", "status":"408" }
{ "time":"[01/May/2021:00:00:00.015 -0300]", "path":"page198", "status":"404" }
Performance measurement
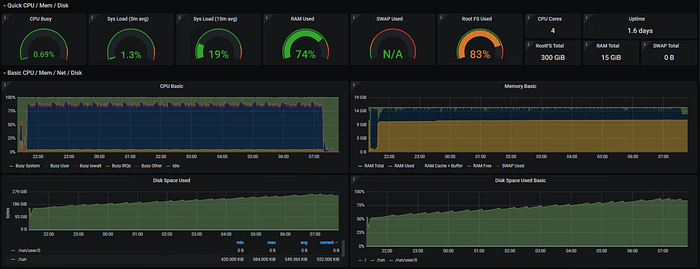
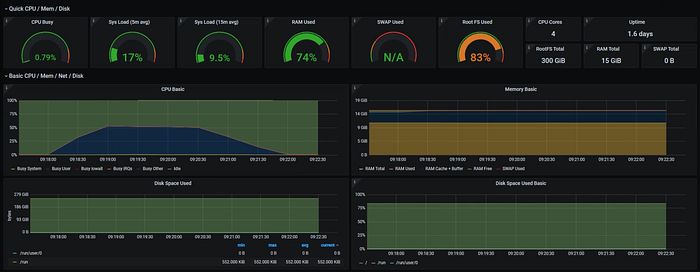
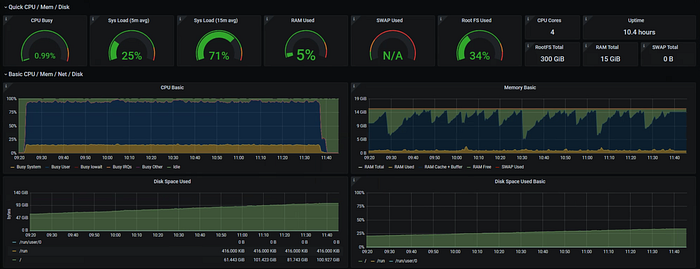
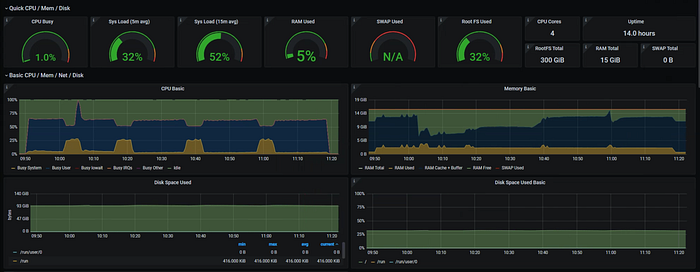
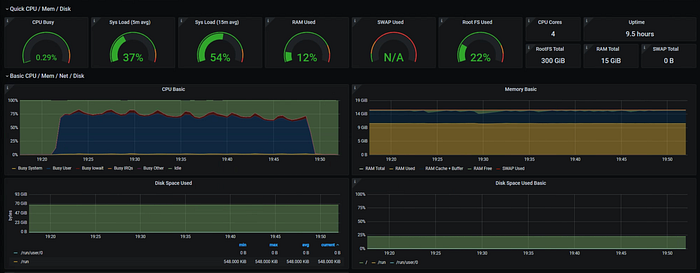
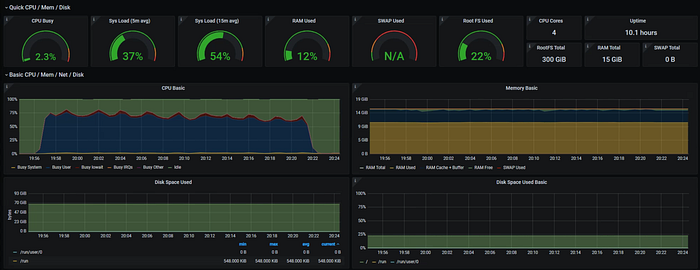
Application logs and instance metrics were scraped using prometheus node_exporter.
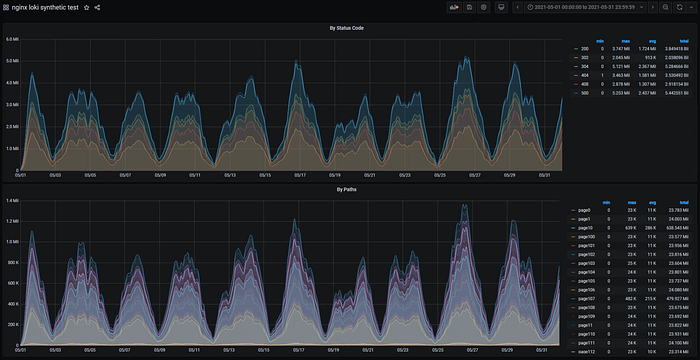
For measurement I’ve measured the time taken to render two common visualizations when it comes to webserver visibility needed.
- Number of connections per status_code
- Number of connections per path
Two time ranges were also used:
- The whole month
- 1 day
Workload
The data used can be easily replicated by running the script below:
import pandas as pd
import math
import os
import random
import datetime
import numpy as np
import matplotlib.pyplot as plt
random.seed(8)
status_codes = [200, 304, 500, 408, 404, 302]
status_codes += [s for s in status_codes for i in range(random.randint(10,50))]
# dummy_weight
paths = [f"page{i}" for i in range(0, 300)]
paths += [p for p in random.sample(paths, 20) for i in range(random.randint(10,50))]
series = []
variance = 0
start = datetime.datetime(2021,5,1)
for i in range(310):
variance += (random.random() - 0.5)/10
val = math.cos(i/10) + variance
series.append(abs(val) * random.randint(8,40)*1000)
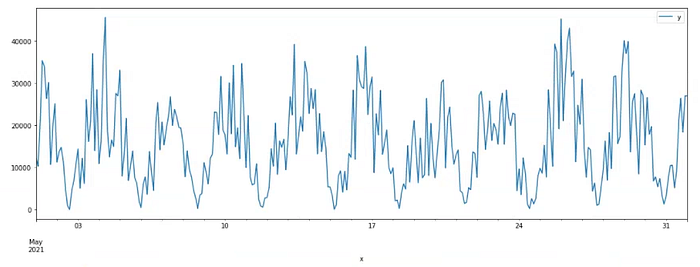
df = pd.DataFrame({"x": [start+datetime.timedelta(minutes=1*i) for i in range(len(series))], "y": series})
df.set_index('x').plot(figsize=(18,6))
# oversample to millisecond granularity
# 31days * 24hours * 60minutes = 44640
arr = [float('nan') for i in range(44640)]
for idx,v in enumerate(series):
arr[idx*144] = v
ts_start = datetime.datetime(2021,5,1).timestamp()
x = [datetime.datetime.fromtimestamp(ts_start+60*i) for i in range(len(arr))]
df = pd.DataFrame({"x": x, "y": arr})
df['y'] = df['y'].interpolate(method='linear')
df['y'] = df['y'].astype(int)
df.set_index('x').plot(figsize=(18,6))
logdir = "./logdir"
if not os.path.exists(logdir):
os.mkdir(logdir)
for idx,v in enumerate(df['y'].values):
row = []
dstart = datetime.datetime(2021,5,1) + datetime.timedelta(minutes=idx)
dstart = dstart
filename = logdir + "/" + dstart.strftime("%Y-%m-%d.log")
dstart = float(dstart.timestamp()*1000)
t = np.linspace(0, 59, v) * 1000
for i in t:
ts = int(dstart+i)
ds = datetime.datetime.fromtimestamp(ts/1000.0)
datefmt = ds.strftime("[%d/%b/%Y:%H:%M:%S.%f")[:-3] + " -0300]"
status_code = random.choice(status_codes)
path = random.choice(paths)
row.append(f"{{ \"time\":\"{datefmt}\", \"path\":\"{path}\", \"status\":\"{status_code}\" }}")
if os.path.exists(filename):
with open(filename, "a+") as f:
f.write("\n")
with open(filename, "a+") as f:
f.write("\n".join(row))
It took almost 3h30min hours to generate 42GB of data.
CPU times: user 1h 16min 53s, sys: 1min 16s, total: 1h 18min 10s
Wall time: 3h 28min 21s
File list:
2.9G    logdir/2021-05-01.log
1.1G    logdir/2021-05-02.log
2.3G    logdir/2021-05-03.log
3.1G    logdir/2021-05-04.log
1.4G    logdir/2021-05-05.log
1.5G    logdir/2021-05-06.log
2.7G    logdir/2021-05-07.log
895M    logdir/2021-05-08.log
2.2G    logdir/2021-05-09.log
2.8G    logdir/2021-05-10.log
870M    logdir/2021-05-11.log
1.7G    logdir/2021-05-12.log
3.2G    logdir/2021-05-13.log
2.4G    logdir/2021-05-14.log
818M    logdir/2021-05-15.log
3.6G    logdir/2021-05-16.log
2.2G    logdir/2021-05-17.log
957M    logdir/2021-05-18.log
1.8G    logdir/2021-05-19.log
2.4G    logdir/2021-05-20.log
963M    logdir/2021-05-21.log
2.7G    logdir/2021-05-22.log
2.6G    logdir/2021-05-23.log
664M    logdir/2021-05-24.log
2.8G    logdir/2021-05-25.log
3.8G    logdir/2021-05-26.log
1.2G    logdir/2021-05-27.log
2.7G    logdir/2021-05-28.log
3.3G    logdir/2021-05-29.log
1.4G    logdir/2021-05-30.log
2.0G    logdir/2021-05-31.log
Now, to the applications..
ELK
Deploying EK
sysctl -w vm.max_map_count=262144docker-compose.yaml
version: '2.2'
services:
  es01:
    image: docker.elastic.co/elasticsearch/elasticsearch:7.12.1
    container_name: es01
    environment:
      - node.name=es01
      - cluster.name=es-docker-cluster
      #- discovery.seed_hosts=es02,es03
      - cluster.initial_master_nodes=es01
      - bootstrap.memory_lock=true
      - "ES_JAVA_OPTS=-Xms8g -Xmx8g"
    ulimits:
      memlock:
        soft: -1
        hard: -1
      nofile:
       soft: 65536
       hard: 65536
    volumes:
      - data01:/usr/share/elasticsearch/data
    ports:
      - 9200:9200
    networks:
      - elastickib01:
    image: docker.elastic.co/kibana/kibana:7.12.1
    container_name: kib01
    ports:
      - 5601:5601
    environment:
      ELASTICSEARCH_URL: http://es01:9200
      ELASTICSEARCH_HOSTS: '["http://es01:9200"]'
    networks:
      - elasticvolumes:
  data01:
    driver: localnetworks:
  elastic:
    driver: bridge
Installing Logstash
rpm --import https://artifacts.elastic.co/GPG-KEY-elasticsearch
cat <<EOF > /etc/yum.repos.d/logstash.repo
[logstash-7.x]
name=Elastic repository for 7.x packages
baseurl=https://artifacts.elastic.co/packages/7.x/yum
gpgcheck=1
gpgkey=https://artifacts.elastic.co/GPG-KEY-elasticsearch
enabled=1
autorefresh=1
type=rpm-md
EOF
yum -y install logstash
echo "export PATH=\"/usr/share/logstash/bin/:$PATH\"" >> /root/.bashrc
export PATH="/usr/share/logstash/bin/:$PATH"
logstash config
input {
    file {
        path => "/root/wkdir/logs/*.log"
        start_position => "beginning"
        #codec => multiline {
        #    pattern => '.*128=.*'
        #    negate => false
        #    what => previous
        #}
        sincedb_path => "/dev/null"
    }
}# https://stackoverflow.com/questions/27443392/how-can-i-have-logstash-drop-all-events-that-do-not-match-a-group-of-regular-exp
filter {
    grok {
        add_tag => [ "valid" ]
        match => {
            "message" => [
                ".*?"time":"(?P<time>[^"]+)".*?path":"(?<path>[^"]+)".*"status":"(?<status>[^"]+)""
            ]
        }
    }
    # https://discuss.elastic.co/t/what-is-the-date-format-to-be-used-with-logstash-to-match-9-digits-millisecond/107032
    # https://discuss.elastic.co/t/how-to-replace-timestamp-with-logtime/118949/2
    # 20210521-23:47:00.333333333
    date {
        match => ["time", "yyyyMMdd-HH:mm:ss.SSS Z"]
        target => "@timestamp"
        remove_field => ["time"]
    }if "_grokparsefailure" in [tags] {
        drop {}
    }if "valid" not in [tags] {
        drop { }
    }mutate {
        remove_tag => [ "valid" ]
        #remove_field => [ "message" ]
    }
}output {
    elasticsearch {
        hosts => ["localhost:9200"]
        index => "nginx"
    }
    #stdout {
    #    codec => json_lines
    #}
}
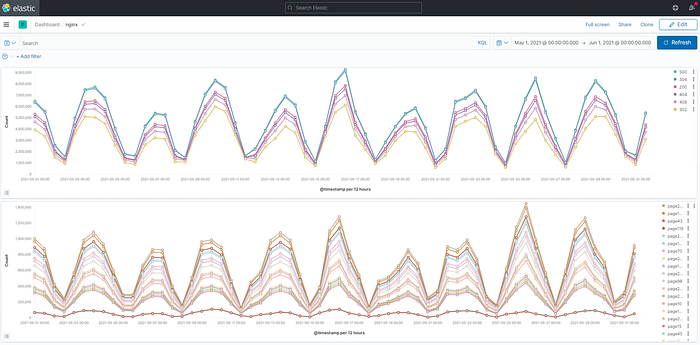
ELK took about 10 hours to ingest all data and accounted for over 100GB of indexed data.
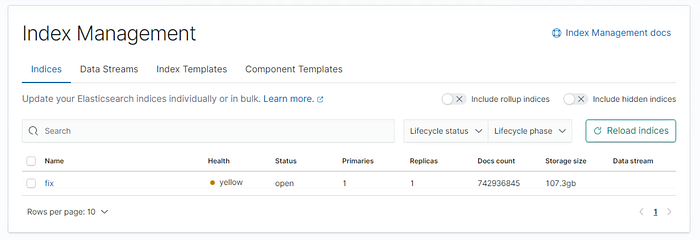
On one hand ELK’s ingest time was long and utilized disk size was almost twice the dataset size but, on the other hand the queries were pretty fast.
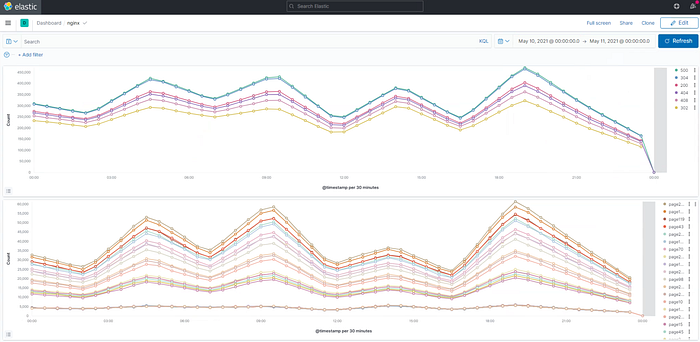
Querying 1 month (12/12h interval) of data only took 4mins and 1 day query was instantaneous.
SPLUNK
Download and install SPLUNK Enterprise trial here.
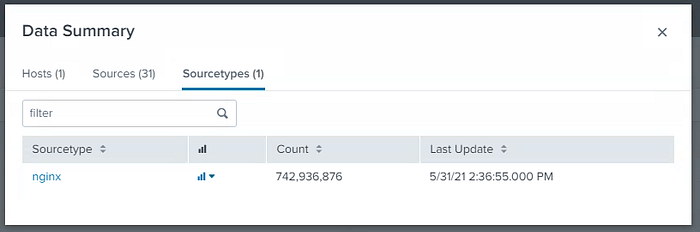
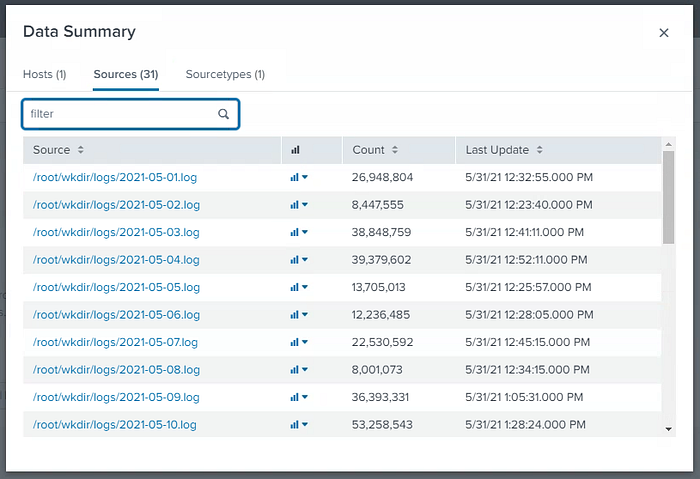
Splunk is very complete when it comes to usability. I didn’t need to touch the CLI after installing it. Configuration and data ingestion were all done using the web ui, even timestamp formating, that’s a plus.
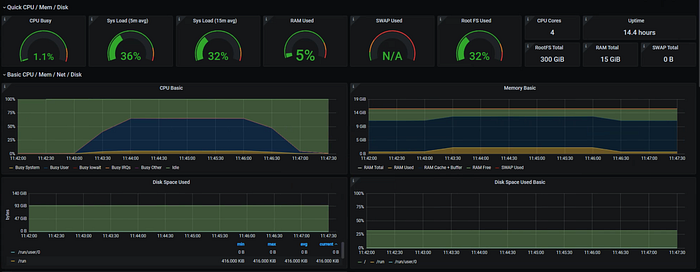
It took almos 2h20minutes to ingest all data which resulted a total of 40GB of data indexed.
Regex:
.*?"time":"\[(?P<time>[^\]]+)\]".*?path":"(?<path>[^"]+)".*"status":"(?<status>[^"]+)"1 Month query
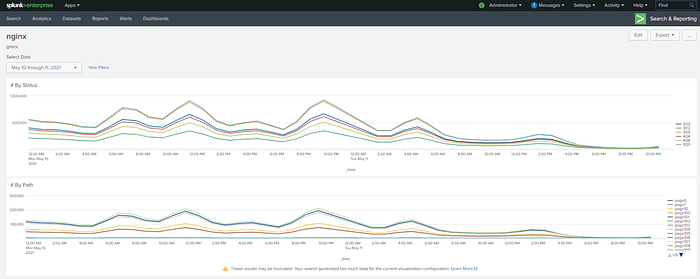
Querying the whole month took around 1h30mins to display the results. Quite a lot!
Query by status:
sourcetype=nginx | timechart useother=f limit=1000 span=1h count by statusQuery by path:
sourcetype=nginx | timechart useother=f limit=1000 span=1h count by path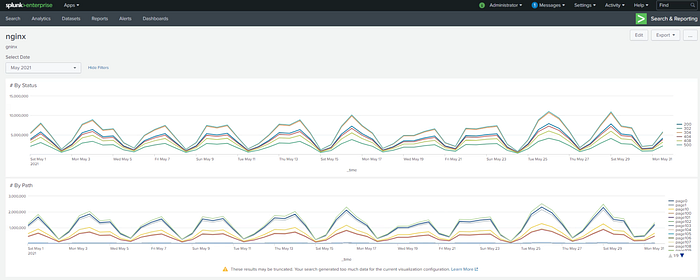
1 Day Query
1 Day length query was faster. It took around 4minutes.
Grafana Loki
Loki being the “new kid” amongst its peers surprised me in many aspects. Also Grafana dashboards itself amazes me everytime I plot something there. Anyway.. let’s continue.
docker-compose.yaml
version: "3"networks:
  loki:services:
  loki:
    image: grafana/loki:2.2.0
    ports:
      - "3100:3100"
    volumes:
      - ./loki-config.yaml:/etc/loki/local-config.yaml
    command: -config.file=/etc/loki/local-config.yaml
    networks:
      - lokipromtail:
    image: grafana/promtail:2.2.0
    volumes:
      - ./logs:/logs
      - ./promtail-config.yaml:/etc/promtail/config.yaml
    command: -config.file=/etc/promtail/config.yaml
    networks:
      - loki#  grafana:
        #    image: grafana/grafana:latest
        #    ports:
        #      - "3000:3000"
        #    networks:
        #      - loki
loki-config.yaml
auth_enabled: falseserver:
  http_listen_port: 3100
  grpc_listen_port: 9096
  http_server_read_timeout: 20m
  http_server_write_timeout: 20mingester:
  wal:
    enabled: true
    dir: /tmp/wal
  lifecycler:
    address: 127.0.0.1
    ring:
      kvstore:
        store: inmemory
      replication_factor: 1
    final_sleep: 0s
  chunk_idle_period: 1h       # Any chunk not receiving new logs in this time will be flushed
  max_chunk_age: 1h           # All chunks will be flushed when they hit this age, default is 1h
  chunk_target_size: 1048576  # Loki will attempt to build chunks up to 1.5MB, flushing first if chunk_idle_period or max_chunk_age is reached first
  chunk_retain_period: 30s    # Must be greater than index read cache TTL if using an index cache (Default index read cache TTL is 5m)
  max_transfer_retries: 0     # Chunk transfers disabledschema_config:
  configs:
    - from: 2020-10-24
      store: boltdb-shipper
      object_store: filesystem
      schema: v11
      index:
        prefix: index_
        period: 24hstorage_config:
  boltdb_shipper:
    active_index_directory: /tmp/loki/boltdb-shipper-active
    cache_location: /tmp/loki/boltdb-shipper-cache
    cache_ttl: 24h         # Can be increased for faster performance over longer query periods, uses more disk space
    shared_store: filesystem
  filesystem:
    directory: /tmp/loki/chunksquerier:
  query_timeout: 20m
  engine:
    timeout: 20mcompactor:
  working_directory: /tmp/loki/boltdb-shipper-compactor
  shared_store: filesystemlimits_config:
  reject_old_samples: false
  ingestion_rate_mb: 16
  ingestion_burst_size_mb: 32
  max_streams_per_user: 100000
  #reject_old_samples_max_age: 168hchunk_store_config:
  max_look_back_period: 0stable_manager:
  retention_deletes_enabled: false
  retention_period: 0sruler:
  storage:
    type: local
    local:
      directory: /tmp/loki/rules
  rule_path: /tmp/loki/rules-temp
  alertmanager_url: http://localhost:9093
  ring:
    kvstore:
      store: inmemory
  enable_api: true
  search_pending_for: 20m
promtail-config.yaml
server:
  http_listen_port: 9080
  grpc_listen_port: 0
positions:
  filename: /tmp/positions.yaml
clients:
  - url: http://loki:3100/loki/api/v1/pushscrape_configs:
- job_name: receive_nginx
  pipeline_stages:
  - match:
      selector: '{job="nginx"}'
      stages:
        - json:
            expressions:
              time:
              path:
              status:- labels:
            path:
            status:

        - timestamp:
            #{ "time":"[01/May/2021:23:59:58.979 -0300]", "path":"page260", "status":"200" }
            source: time
            format: "[02/Jan/2006:15:04:05.000 -0700]"

  static_configs:
  - targets:
      - nginx
    labels:
      job: nginx
      __path__: /logs/*.log
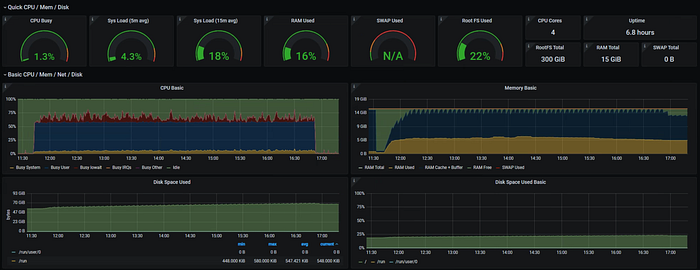
Loki took over 6 hours to ingest and consumed only 9GB of disk space (that’s incredible!)
1 Month Query
Query by status:
sum by (status) (
    count_over_time({job="nginx"})
    [$__interval]
    )
)
Query by path:
sum by (path) (
    count_over_time({job="nginx"})
    [$__interval]
    )
)
Query 1 month of data took about 27minutes (30s interval) with a disk footprint of 70GB read.
loki_1      | level=info ... length=744h0m0s step=20m0s duration=27m20.345708133s status=200 limit=1944 returned_lines=0 throughput=43MB total_bytes=70GB
loki_1      | level=info ... length=744h0m0s step=20m0s duration=27m22.792997646s status=200 limit=1944 returned_lines=0 throughput=43MB total_bytes=70GB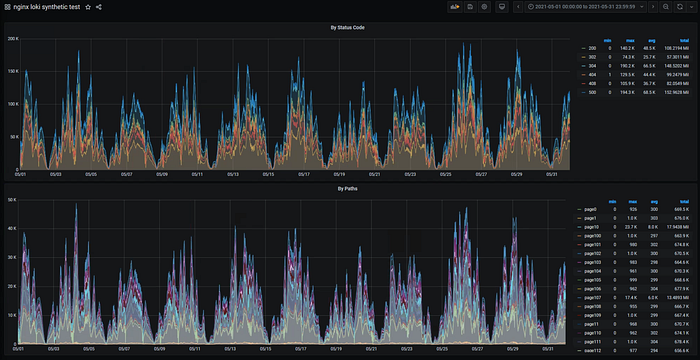
1 Month (12/12h interval) also took the same time
1 Day Query
Querying 1 day of data took about 1min
loki_1      | ... length=24h0m0s step=30s duration=51.944914194s status=200 limit=1944 returned_lines=0 throughput=59MB total_bytes=3.1GB
loki_1      | ... length=24h0m0s step=30s duration=53.915508495s status=200 limit=1944 returned_lines=0 throughput=57MB total_bytes=3.1GB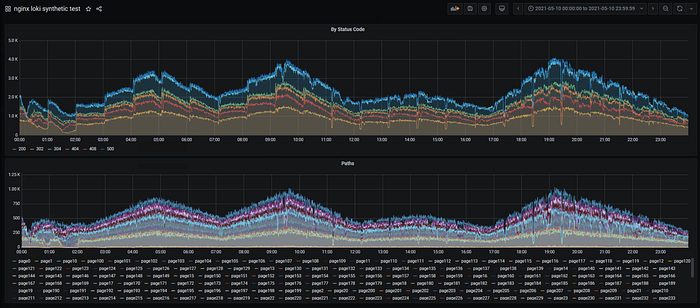
Conclusion
As I sort of dumped a bunch of configurations, time measurements and notes on the sections above. Let’s organize them a bit.
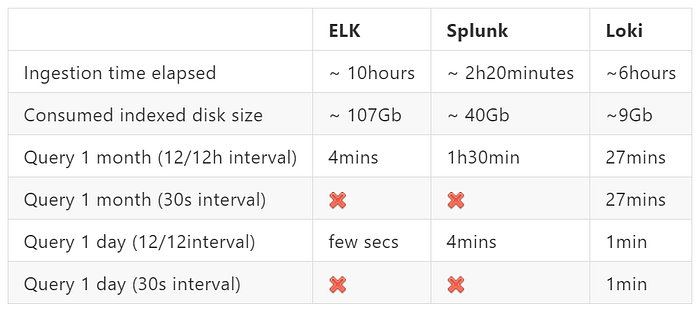
As one can see, each software has its own perks as well as downsides. Grafana Loki being the only one that allows interval customization (others allow but up to a limit).
The right solution platform really depends on each administrator needs.
Further work
I’m pretty sure other configuration tunning can be done. We could also explore cluster setups. But, overall, this already gives us a good starting point whether of not you’re assessing your next CLM — Centralized Logging Management mission.
That’s all! Thank you.
If you enjoyed it please like it.
Feel free to drop a comment too.